| SHIPPING RATES & BUNKERS ( 9:30 am ET ) | |||
| DIRTY TANKER (KT - $/day) | VOYAGE | SPOT TCE EARNINGS | 2018 AVG. RATE |
| VLCC, 270 | AG-FE | 47,100 | 18,100 |
| Suezmax, 130 | WAF-UKC | 22,800 | 9,800 |
| Aframax, 70 | CAR-USG | 38,800 | 12,100 |
| Panamax, 50 | CAR-USG | 16,600 | 8,900 |
| CLEAN TANKER (KT - $/day) | VOYAGE | SPOT TCE EARNINGS | 2018 AVG. RATE |
| MR, 37 | UKC-USAC | 21,500 | 6,800 |
| MR, 38 | USG-UKC | 19,200 | 2,200 |
| TIME CHARTER (KDWT) | 1YR ECO RATE ($/day) | NEWBUILD PRICE ($M ) | SECONDHAND 5YR PRICE ($M) |
| VLCC , 200+ | 37,000 | 92.0 | 64.0 |
| Suezmax, 130-200 | 24,000 | 62.0 | 44.5 |
| Aframax, 80-130 | 19,000 | 48.0 | 31.0 |
| LR2, 80-130 | 18,500 | 50.0 | 32.0 |
| LR1, 60-80 | 14,250 | 43.0 | 25.0 |
| MR, 42-60 | 14,500 | 36.0 | 26.0 |
| Handymax. 30-42 | 13,000 | 33.0 | 24.0 |
| US FLAG (KT - $/day) | VOYAGE | WEEKLY SPOT RATE | 2018 AVG. RATE |
| Handy, 38 | USG-USAC | 67,563 | 61,513 |
| LNG ($/day) | WEEKLY SPOT RATE | CURRENT MONTH RATE | 2018 AVG. RATE |
| 160M3 Tri-fuel diesel electric (West) | 120,000 | 120,000 | 79,408 |
| 138-150M3 Steam turbine (West) | 90,000 | 90,000 | 56,776 |
| 160M3 Tri-fuel diesel electric (East) | 140,000 | 140,000 | 79,735 |
| 138-150M3 Steam turbine (East) | 95,000 | 95,000 | 52,612 |
| LPG (KT) | LAST POSTED SPOT RATE ($/mt) | SPOT TCE RATE ($/day) | 1yr TIME CHARTER RATE ($/day) |
| VLGC, 44 (AG-Japan) | 37.93 | 21,382 | 21,382 |
| BUNKERS ($/mt) | IFO 380 | MDO | |
| US Gulf | 365.5 | 596.0 | |
| Rotterdam | 356.0 | 535.0 | |
| Singapore | 397.0 | 553.0 | |
ENERGY NEWS
Upcoming changes in marine fuel sulfur limits will impact oil markets.
The IMO, a UN agency with 171 members, is on track to mandate a limit reduction to sulfur content in marine fuels from 3.5% to 0.5% by 2020. To comply with the new limits, vessel operators can switch to lower sulfur fuel. However, cost, availability and specifications of a new fuel remain uncertain. Another option is to use scrubbers to remove pollutants from ship exhausts, allowing operators to continue higher-sulfur fuels. The installation of scrubbers can be costly, increasing a ship's operating costs. A few vessels have already installed scrubbers, and that is not expected to increase by much before 2020. Other nonpetroleum-based fuels are an option as well such LNG, but the infrastructure to support the use of LNG as a fuel is currently limited. Refiners will have to increase the supply of low sulfur products for marine use.
Suncor Energy sees 2019 upstream production up 10%.
The Canadian major said it expects average upstream production to rise 10% next year, despite implementing Alberta's mandated output cuts. The province has mandated temporary output drawbacks of 325,000 bpd until excess crude in storage is drawn down, coming into effect Jan. 1. This comes as prices for Canada's heavy crude slump due to pipeline bottlenecks. Lower prices benefit heavily integrated producers such as Suncor as they can feed their refiners at a lower cost.
Reuters Dec. 14, 2018
Construction work begins on Texas wind farm.
Spanish firm Acciona Energia has commenced construction work on its second wind farm in Texas. The Palmas Atlas project will have a capacity of 144.9 MW, using 46 wind turbines. When fully operational, the farm will generate around 524 GWh of energy annually, feeding the equivalent consumption of 43,000 US homes. The farm will be responsible for offsetting the emission of 503,000 MT of CO2, according to the company.
Iran falls to sixth largest oil supplier to India in Nov., down from fourth in Oct.
India's imports of Iranian crude fell to their lowest level in a year in Nov., due to the effects of US sanctions. India received waivers from Washington's sanctions on Tehran, allowing it to continue importing oil from Iran. However, India is restricted to buying only about 300,000 bpd a month. In Nov., India imported around 276,000 bpd of Iranian oil, a 41% decline from Oct. Iraq and Saudi Arabia remained the largest two suppliers of oil to India. The UAE came in third, after being the sixth biggest in Oct., beating Venezuela for the position.
| COMMODITIES, (9:35 am ET ) | ||||
| CRUDE | SOURCE | UNIT | LAST PRICE | Δ PRIOR DAY CLOSE |
| Brent | ICE | $/bbl | 61.32 | -0.13 |
| WTI | NYMEX | $/bbl | 52.45 | -0.13 |
| Dubai (Spot) | Bloomberg | $/bbl | 59.69 | +0.76 |
| PRODUCTS | SOURCE | UNIT | LAST PRICE | Δ PRIOR DAY CLOSE |
| RBOB Gasoline | NYMEX | ₵/gal | 146.15 | -1.67 |
| Heating Oil | NYMEX | ₵/gal | 187.45 | -0.20 |
| NATURAL GAS | SOURCE | UNIT | LAST PRICE | Δ PRIOR DAY CLOSE |
| US Henry Hub | NYMEX | $/MMBtu | 3.96 | -0.17 |
| UK National Balancing Point | ICE | $/MMBtu | 8.55 | +0.14 |
| NATURAL GAS LIQUIDS | SOURCE | LAST PRICE (₵/gal) | LAST PRICE ($/mt) | Δ PRIOR DAY CLOSE(₵/gal) |
| US Mont Belvieu Propane (Spot) | Bloomberg | 69.00 | 359.68 | - |
| PRICE SPREADS ($/bbl) | SOURCE | LAST PRICE | Δ PRIOR DAY CLOSE | |
| Brent 3-2-1 Crack | ICE | 5.83 | -0.35 | |
MARKETS
| MARKETS, ( 9:35 am ET ) | ||||
| EQUITIES | REGION/COUNTRY | LAST VALUE | Δ PRIOR DAY CLOSE | |
| S&P 500 | United States | 2,650.54 | -0.53 | |
| FTSE 100 | United Kingdom | 6,848.07 | -29.43 | |
| DAX | Germany | 10,867.78 | -56.92 | |
| Nikkei | Japan | 21,374.83 | -441.36 | |
| SH Composite | China | 2,593.74 | -40.31 | |
| CURRENCIES | REGION/COUNTRY | LAST VALUE | Δ PRIOR DAY CLOSE | |
| £/$ | United Kingdom | 1.26 | -0.01 | |
| €/$ | European Union | 1.13 | -0.01 | |
| $/JPY ¥ | Japan | 113.61 | -0.01 | |
| $/CNY ¥ | China | 6.91 | +0.03 | |
MARKET ANALYSIS
- Asphalt: West Coast markets slipped lower in many areas last week.
- LNG: While tonnage availability in the Far East looked to be increasing last week for Dec. and Jan. as vessels were redelivered, commercial terms are expected to remain bullish throughout winter.
- LPG: Kuwait Oil Tanker Company confirmed that it placed an order for three VLGCs of 84,000 cmb each at Hyundai Heavy Industries at around $7.1M apiece. One vessel is expected to deliver in Q4 2019 while the remaining two are expected within 1H 2020.
- Oil prices slip on weak economic data from China.
- Pound continues to fall, nears 20-month low.
DEC. POSTED / SPOT PRICES ($/mt)
| DEC. POSTED / SPOT PRICES ($/mt) | Propane | Butane |
| Saudi Aramco | 445.00 | 415.00 |
| Sonatrach | 385.00 | 375.00 |
| OPIS North Sea | 391.00 | 356.00 |
| Spot AG | 437.50 | 418.50 |
| CFR Japan | 428.50 | 473.00 |
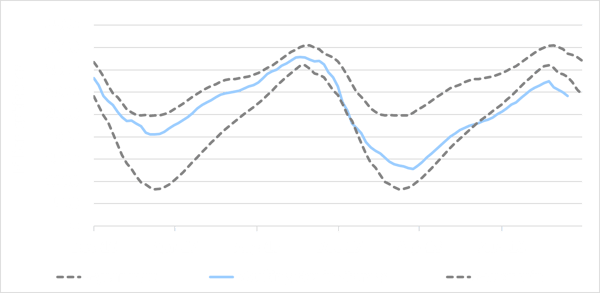
EIA US WORKING NATURAL GAS IN UNDERGROUND STORAGE
(Dec. 2016 - Dec. 2018)